It’s been quite weird to sit in Australia, especially New South Wales, and watch the covid19 pandemic spread around the world. The main experience of covid here has been one of a miserable but fairly short lockdown, followed by ongoing minor inconvenience.
This, obviously, put us in an extremely lucky position by world standards. We haven’t seen thousands of sick and elderly people die while thousands of healthy young people suffer serious, maybe permanent, heart and lung damage. We’ve also mostly managed largely to prevent these things from happening without suffering from long-term draconian restrictions.
Because Australia is a nation of bizarre whiners, however, no response can possibly be good enough. I’m not going to talk about the “die for stocks!” types here, because they don’t deserve a response, but be assured that we have them. The odder reaction is the “doom, doom” response from people who recognise that the virus is serious, but can’t believe that NSW has been able to keep cases and hence deaths at negligible levels without draconian measures. Their broad counter-narrative is “NSW was just lucky, and also of course Victoria hasn’t traced contacts well, because it had a massive outbreak that nobody could have traced”.
These points are both very wrong.
I’ve put together a few charts covering NSW and Victoria around “unknown” covid19 cases – cases that were locally acquired and have not been traced to a known source. The charts are based on published data from covidlive.com.au, not on my own extrapolations (I have the integrity standards of a blogger, rather than some niche charlatan!). Absolute numbers are shown in bars, percentage shares in lines. NSW is blue and Victoria is red/orange.
First up, total cases and unknown % of total cases:
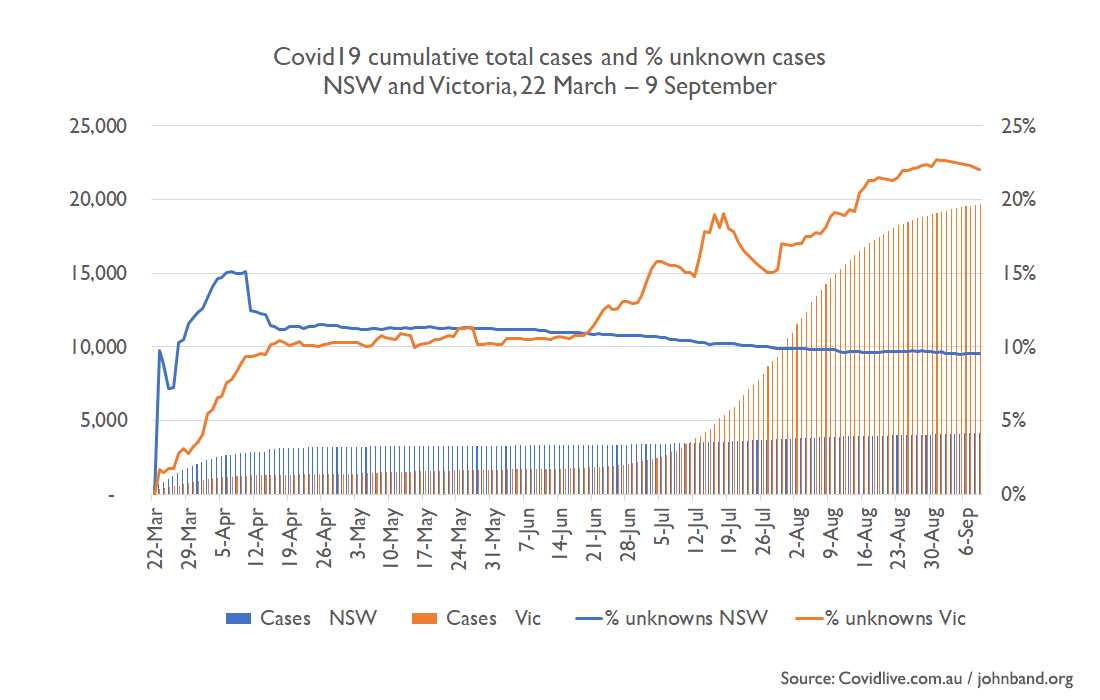
NSW started off with rapid growth in covid19 cases and of unknowns (to over 15% of the total), in the early pre-lockdown days. Since then, continued tracing has brought the total unknown rate down, but it has stayed around 10% – driven almost entirely by cases that occurred before lockdown. The blue bars highlight the fact that “second wave” cases in NSW are so low they barely even show up on the map. In Victoria, cases didn’t catch up to NSW’s total until mid-July, after second wave lockdowns had begun. A month earlier, in mid-June, total Victorian unknowns overtook NSW unknowns – and then raced out of control to their current levels.
Although that graph provides a big picture overview, it doesn’t make all that clear exactly what was going on in June, after we got out of lockdown but before the Victorian second wave took off. This one does a better job. It shows a seven-day rolling average of case numbers and of the percentage of cases that are unknown:
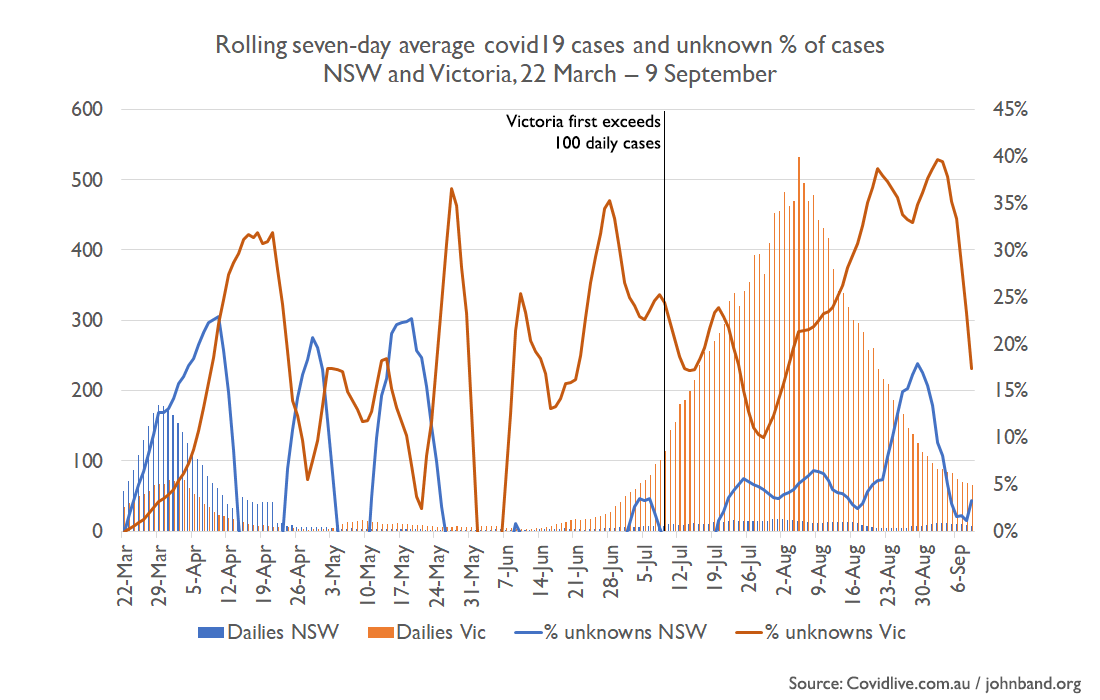
Victoria did show a high percentage of unknown covid19 cases when the daily case rate was high, as the right hand side of the graph makes clear. But if you look at the data for June, Victoria was also showing a high percentage of unknown cases then, at a point when overall case numbers were still small, and well within the capacity of a decent tracing system to manage.
Although it shows the overall trend, that graph is a bit all-over-the-place. It also has a weird quirk that you may have noticed: unknown cases don’t peak until some time after the peak in total cases. This is because Victoria allowed the “under investigation” category to blow out, peaking on 5 August at 3969 cases. Some of these cases were later traced, but most were transferred to the unknown pile later in August.
So… here’s a final graph which plots daily locally transmitted cases (because we don’t care about hotel quarantine cases unless they infect the guards) against daily cumulative (so that everything doesn’t wiggle around quite as much) unknown plus under-investigation cases (because of the Victorian data quirk), all starting on May 1 (because we don’t care what happened before the first lockdown):
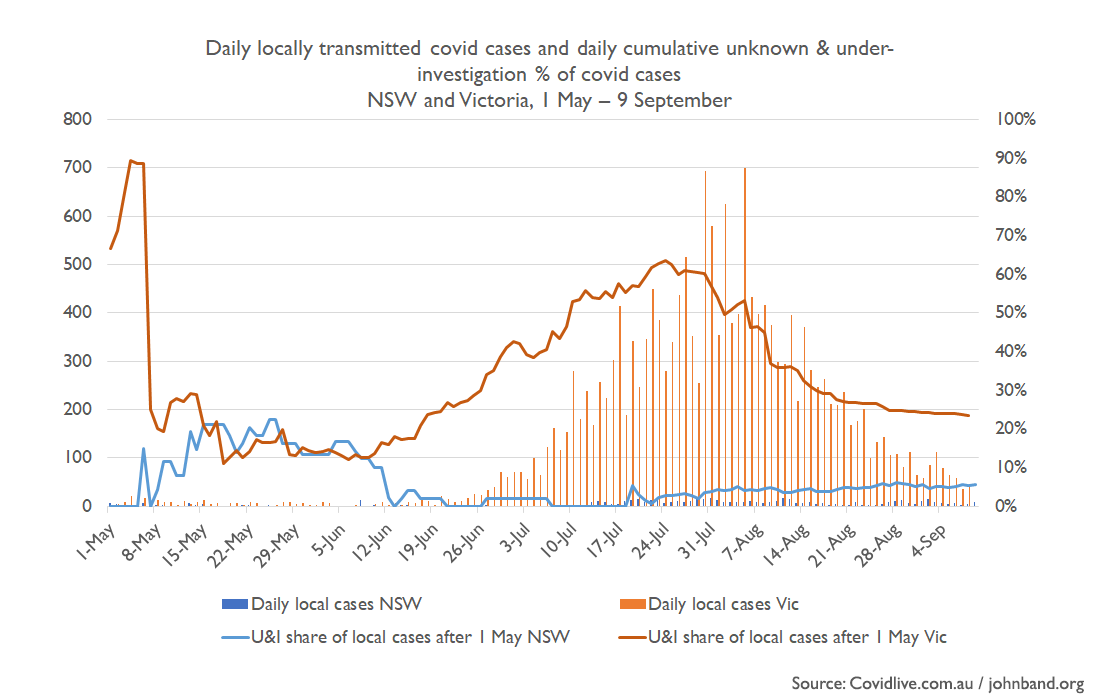
This graph shows that unknown local transmission got out of hand in Victoria by the middle of June, and that contact tracing overall improved significantly from the end of July onwards. That’s a great sign for Victorians going forward: they appear to have learned from the gold standard.
Here’s one bonus chart, this one sourced from the weekly NSW Health Covid19 Surveillance report for the week ending 5 September 2020:
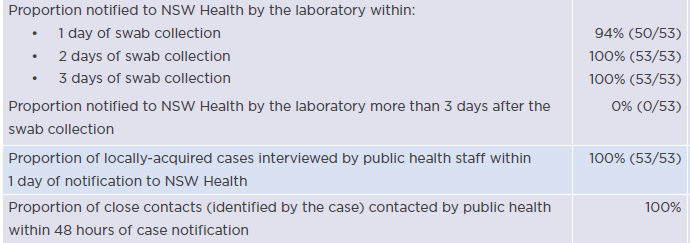
At the moment, 94% of positive individuals are notified (to themselves and to NSW Health) within 24 hours of getting a swab. The other 6% are notified within 48 hours. Every single case is interviewed by NSW Health within a day of the positive result. Every single case has their close contacts contacted by NSW Health staff within two days of the positive result. So in 96% of cases, all close contacts are contacted within three days of the patient getting a swab, and in the remaining 4% it’s within four days. That’s pretty damn impressive.
Writing as someone who is *very* surprised (and pleased) at the efficacy of NSW contact tracing, I’m going to argue that it’s been a complete and total failure.
I’ll just repeat: a complete and total failure. Not a spectacular failure like Victoria, just complete and total one.
The Crossroads even occurred more than 10 weeks ago, there have been over 1000 local cases in NSW since, and the epidemic is still spreading. It’s possible the ongoing epidemic is not all related to Crossroads (the CBD clutter may have been a Hotel Quarantine breach, and Bateman’s Bay may have been a Victorian traveller) – but answering that question is beyond the limitations of our contact tracing capabilities.
The fact we have not had an unmitigated disaster (yet), should not in any way be regarded as a “gold standard”. NSW is still at significant risk of a Victorian style outbreak, while we are making little or no progress toward practical elimination.
NSW Contact Tracing appears to be finding and isolating ~95% of cases – eventually. For COVID to to eliminate itself, *all* of those 5% who are infectious without knowing it need to voluntarily isolate just for the hell of it. For NSW not to have an explosive outbreak, we have to rely on that persistent 5% never being super-spreaders.
In the mean time, pubs and cafes are all open, but with half their usual attendance and most aren’t viable. Public transport is still running, but people aren’t using it, and being advised not to.
The current situation is unsustainable, one way or another.
The inconvenient truth is Testing and Contact Tracing doesn’t stop COVID19 transmission. Isolating infectious people does. ATM, “draconian measures” are the only thing that have worked in Australasia. Contact tracing – even if done perfectly is retrospective. The inconvenient truth is (and we know this thanks to the contact tr4acing) had NSW pubs, eateries, gyms and churches been closed for 3 weeks after Crossroads was discovered, combined with aggressive contact tracing COVID could have been effectively eliminated, But that was too inconvenient, so we remain stuck in no-man’s land.